Article by Ashley Owen
Last month, traders seemed to be shrugging collectively at the coronavirus in assuming China had been largely successful containing the outbreak to epidemic rather than pandemic levels.
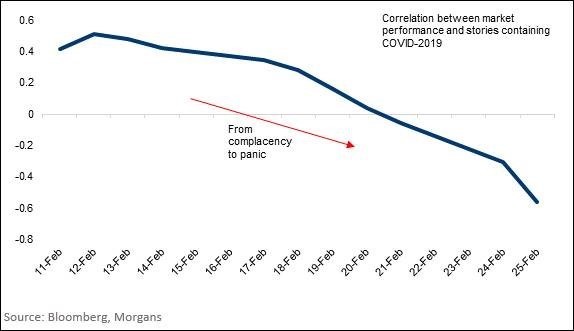
How quickly things change. Markets plunged at the end of February after reports of outbreaks in Japan, South Korea, Italy and Iran. As we can see below, traders shifted (at least temporarily) from complacency to panic.
However, volatile and unpredictable markets have more recently delivered two 4% rallies in the US in three days after Congress authorised virus prevention spending and the Federal Reserve cut interest rates. Share prices will remain under pressure as analysts consider how coronavirus will affect company earnings and the broader global economy.
The good news for investors is that the world’s governments are hell-bent on avoiding recession. At first, Australia’s Prime Minister Scott Morrison had ruled out fiscal stimulus to prop up the local economy, but soon changed tack as he floated the option of stimulus to combat a global pandemic.
The challenge of the coronavirus is that it isn’t deadly enough.
The H5N1 avian flu has a mortality rate of 60%, but because it is so deadly there are few opportunities for widespread infection.
On the other hand, the common flu has a mortality rate of less than 0.1% but is easily spread due to its relatively mild symptoms. Most people don’t experience severe symptoms with the coronavirus, meaning they are likely to infect others before being diagnosed.
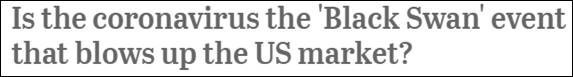
When major news outlets are running headlines like this, it’s little surprise that investors are wondering whether they should be battening down the hatches.
For long-term investors, the question is whether the coronavirus is going to have lasting implications for investor portfolios.
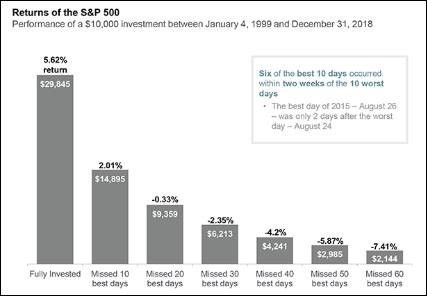
Investing timeframes should be years and decades, not days and weeks, and markets cannot be timed perfectly. As we can see below, failing to time the markets correctly is a costly proposition.
Comparing previous virus plagues
There have been three major pandemics over the past 100 years, which have killed millions of people not just the odd thousand or so. In terms of their effect on share markets, the chart below shows the total returns including dividends but after inflation for Australian (green) and US (red) shares since 1900.

1918-19 ‘Spanish’ flu A/H1N1
The victims of the 1918-19 Spanish Flu were mainly healthy individuals between 20- and 50-years-old, in stark contrast to other pandemics that affected mainly infants and the elderly.
Spanish Flu was first observed in Europe, the US and across Asia but swiftly spread around the world.
In Australia, 40% of the total population was infected and 15,000 people died. We had one of the lowest death rates globally, at just 2.7 deaths per 1,000 population. The Federal government set up the Commonwealth Serum Laboratories (now CSL) near the end of the War to develop local vaccines and its first major success was a vaccine for Spanish Flu.
Despite infecting one third of the world’s population, killing 50 million people and hospitalising hundreds of millions more, the impact on share markets was limited.
In the immediate post-war years, share markets were hit by a massive bout of post-war inflation (20%+ in Australia and the US) and equally damaging fiscal and monetary tightening to fight inflation. If anything, the deaths of 50 million people and spending cuts by hundreds of millions who were infected may well have prevented the inflation spikes from being worse than they turned out to be.
In any event, once the inflation was brought down by sharp recessions in 1920-21, share prices took off and started the long 1920s boom driven by post-war housing, urbanisation and new technology – motor cars, radios and other household appliances.
1957 ‘Asian flu’ A/H2N2 virus
It is thought to have started from animal and human H1N1, and avian H2N2 virus strains, in China’s Yunnan province before spreading through Hong Kong to the rest of the world. The Asian flu killed between 1 million and 2 million people worldwide, mainly infants and the elderly, including 70,000 Americans but only 2 in Australia.
Shares were unaffected by the crisis and kept rising in Australia and the US during the great 1950s post-World War 2 boom that was fuelled in both countries by housing, infrastructure and consumer finance – not unlike the 1920s post-WW1 share boom.
1968-70 ‘Hong Kong flu’ A/H3N2
This pandemic came in two waves across the world, the first in 1968-69 and second in 1969-70. It is thought to have originated as a mixed infection of an animal with human H2N2 and avian H3Nx virus strains in Asia. It killed around 1 million people globally, mainly elderly, including 34,000 Americans and 2,400 Australians.
At the time, share markets were enjoying the 1960s ‘space race’/ aeronautics boom in the US. This surge triggered the speculative mining boom in Australia, especially in metals like nickel which was used in aeronautics, and was also in high demand for armaments in the Vietnam War.
2009-10 – ‘Swine Flu’ or ‘Mexican flu’ – H1N1
This originated in Mexico and spread around the world, infecting between 700 million and 1.4 billion people and killing about 200,000, mainly the young, including 12,000 Americans and 1,600 Australians.
For shares, 2009-10 was of course the great rebound from the GFC share market crash. Share prices powered through the flu pandemic and other crises including:
- the European bank runs
- first Greek debt bailout
- Iceland and Irish bankruptcies and bailouts
- Dubai debt crisis.
Where to from here?
No cure or vaccine for the coronavirus has been developed yet, so the infection rate and death toll are probably going to keep spreading rapidly. But the rate of spread appears to be slowing.
In January the growth rate of infection was running at 50% per day, but fell to 30% per day in early February, and now appears to be 15% per day (on official figures anyway).
The growth rate makes a difference.
At 50% per day it would take just 30 days to infect the entire world population.
At 30% per day it would take 45 days; and at 15% per day it would take 85 days.
If not contained, at 5% per day it would take 250 days to infect the whole world.
More likely outcomes would be a continued slowing in the rate of spread of the infection, and/or containment or vaccine.
Most of the impacts are likely to be short term, either pulling spending forward that would otherwise have been spent later (e.g. purchases of food, durable goods stockpiled, vitamins, etc), or delaying spending that would be picked up later (factory production, car purchases, travel, etc).
Long-term investors should be focussed on more long-lasting or permanent changes.
50 million people dying of the Spanish Flu took 50 million potential workers and consumers out of the market permanently, but that was right at the start of the tremendous 1920s boom.
Likewise, the 1-2 million people taken out by the late 1950s Asian flu and the late 1960s Hong Kong flu, plus tens of millions infected temporarily in each case, had little impact on markets.
On the other hand, the 1340s-50s Black Death that wiped out one fifth of the global population including at least one third of Europe no doubt would have had large and long-lasting effects on economic output, company profitability and the holders of government and corporate debt.
Ashley Owen is Chief Investment Officer at Stanford Brown. He is also a director of Third Link Investment Managers, a fund that supports Australian charities.
This advice may not be suitable to you because it contains general advice that has not been tailored to your personal circumstances. Please seek personal financial and tax/or legal advice prior to acting on this information. Before acquiring a financial product a person should obtain a Product Disclosure Statement (PDS) relating to that product and consider the contents of the PDS before making a decision about whether to acquire the product. The material contained in this document is based on information received in good faith from sources within the market, and on our understanding of legislation and Government press releases at the date of publication, which are believed to be reliable and accurate. Opinions constitute our judgment at the time of issue and are subject to change. Neither, the Licensee or any of the Oreana Group of companies, nor their employees or directors give any warranty of accuracy, nor accept any responsibility for errors or omissions in this document. Gordon Thoms and David Conte of Calibre Private Wealth Advisers are Authorised Representatives of Oreana Financial Services Limited ABN 91 607 515 122, an Australian Financial Services Licensee, Registered office at Level 7, 484 St Kilda Road, Melbourne, VIC 3004. This site is designed for Australian residents only. Nothing on this website is an offer or a solicitation of an offer to acquire any products or services, by any person or entity outside of Australia.