 How patience has paid off for long-term investors
According to Vanguard’s 2021 Index Chart, investors who stay the course tend to be more successful in the long run than those who try to time when to buy and sell.
In early 2020, over just a few weeks, global share markets tumbled more than 35 per cent.
Sparked by investor panic over the rapid spread of the COVID-19 virus, it was one of the biggest-ever market downturns.
Yet, by the end of last year, markets had recovered most of their lost ground. What’s more, they were once again trading near record highs.
It’s only when you take a long-term view of the performance of share markets over time that you get to see the bigger investment picture.
And it shows that while markets do experience volatility and can sometimes fall quite sharply over short periods, they consistently rise over longer time frames.
Investors who stay the course, rather than trying to time when to buy and sell, tend to be more successful in the long run.
If you invest in products such as managed funds and exchange traded funds that provide broad exposures to markets, you essentially capture the rising returns from those markets over time.
The 2021 Vanguard Index Chart below shows the performance of six different asset types over the last 30 years since 30 June 1991.
These assets are Australian shares, United States shares, international shares, Australian bonds, listed property, and cash.
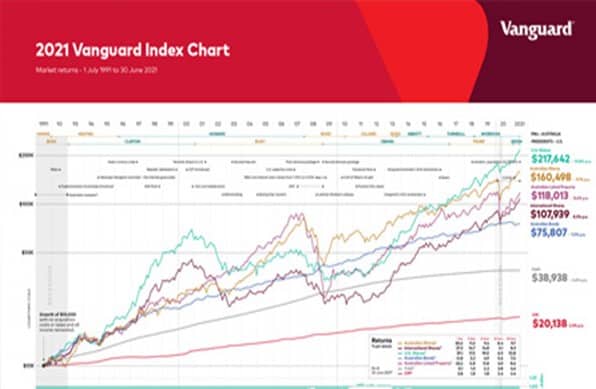
As well as mapping the performance of these assets, the chart shows how a starting investment of $10,000 would have grown over 30 years. The total numbers don’t include any buying costs or taxes and assume all the income received along the way was reinvested back into the same assets.
You can clearly see how investment markets have risen and fallen over time. As well, you can see the shorter-term impacts of major events including the Global Financial Crisis in 2008 and last year’s COVID-19 crash.
How different assets have performed
A $10,000 investment in mid-1991 into the U.S. share market would have grown to $217,642 by 30 June 2021 if all income received had been reinvested back into U.S. shares. That’s based on the 10.8 per cent average annual return from the broad U.S. market over 30 years.
The Vanguard chart also shows how someone who had invested $10,000 back then would have ended up by investing in other asset types.
The same amount invested into Australian shares would have grown to $160,498 based on the 9.7 per cent per annum return from the Australian share market since the start of the 1991-92 financial year.
Left in listed property, which has returned 8.6 per cent per annum, a $10,000 investment would have increased more than 10 times to $118,013. The same goes for international shares, although its 8.3 per cent per annum return delivered a slightly lower outcome and would have turned $10,000 into $107,939.
In Australian bonds, which have returned 7 per cent per annum over 30 years, a $10,000 starting investment would have been worth $75,807 at 30 June this year.
The lowest long-term return over three decades has been from cash.
If you’d left your money in cash it would have earned 4.6 per cent per annum and grown to $38,938. It’s a much lower return than from other asset types. But it’s still almost four times the original amount invested.
The importance of diversification
The returns from the different assets tracked in the Vanguard Index Chart over the last 30 years demonstrates a few key points.
Some assets are more prone to volatility than others. You can see that by comparing how different types of shares have performed over time against the more stable returns of lower-risk assets such as bonds and cash.
During times of uncertainty, shares are likely to be much more volatile than fixed income assets such as bonds. Cash returns, which closely reflect official interest rates, are largely unaffected by what happens on share markets.
You can also see that the returns from different assets vary from year to year. The best-performing assets in some years can be the worst-performing in others.
In the 2020-21 financial year listed property achieved a positive return of 33.2 per cent, which compared with a negative return of 21.3 per cent the year before.
Lastly, the best way to smooth out intermittent volatility and to achieve more consistent returns is to spread your holdings over a range of assets.
The power of compounding returns
The overall financial returns shown in the Vanguard Index Chart are based on an investor having reinvested any income received from their investments back into the same asset type.
By following a strategy of reinvesting investment distributions such as dividends, and by making additional contributions over a long period of time, the combination of market growth and compounding returns will likely deliver strong results.
Even a low initial balance will grow substantially over time when combined with compounding investment returns. It’s why famous scientist Albert Einstein famously described compound interest as “the eighth wonder of the world”.
Next steps
To find out more about how any of these measures may be of assistance in your individual circumstances, please contact Gordon Thoms or David Conte at Calibre Private Wealth Advisers on ph. (03) 9824 2777 or email us here.
The information contained in this article is of a general nature only and may not take into account your particular objectives, financial situation or needs. Accordingly, the information should not be used, relied upon or treated as a substitute for personal financial advice. While all care has been taken in the preparation of this article, no warranty is given in respect of the information provided and accordingly, neither Calibre Private Wealth Advisers, its employees or agents shall be liable for any loss (howsoever arising) with respect to decisions or actions taken as a result of you acting upon such information.
This advice may not be suitable to you because it contains general advice that has not been tailored to your personal circumstances. Please seek personal financial and tax/or legal advice prior to acting on this information. Before acquiring a financial product a person should obtain a Product Disclosure Statement (PDS) relating to that product and consider the contents of the PDS before making a decision about whether to acquire the product. The material contained in this document is based on information received in good faith from sources within the market, and on our understanding of legislation and Government press releases at the date of publication, which are believed to be reliable and accurate. Opinions constitute our judgment at the time of issue and are subject to change. Neither, the Licensee or any of the Oreana Group of companies, nor their employees or directors give any warranty of accuracy, nor accept any responsibility for errors or omissions in this document. Gordon Thoms and David Conte of Calibre Private Wealth Advisers are Authorised Representatives of Oreana Financial Services Limited ABN 91 607 515 122, an Australian Financial Services Licensee, Registered office at Level 7, 484 St Kilda Road, Melbourne, VIC 3004. This site is designed for Australian residents only. Nothing on this website is an offer or a solicitation of an offer to acquire any products or services, by any person or entity outside of Australia.